Cirrus by Panasonic
Moving What Matters: Driving the Connected Vehicle Landscape
Problem:
In 2018, nearly 38,000 people were killed in traffic-related accidents in the United States. On top of that, Americans spent on average 97 hours a year in congestion, costing around $1,350 per driver. With number of vehicles on the roadways and length of time spent in vehicles consistently increasing, the danger is rising and a solution — still unclear.
How Might We Disrupt the Transportation Industry?
V2X (Vehicle-to-everything) technologies have the potential for significant, real-time transportation safety and mobility insights, both on its own, and as a complementary technology to other types of data integrations and applications. This provides an opportunity to drastically reduce the amount of time it takes for transportation departments to understand roadway conditions and take appropriate action, reducing congestion and improving safety.
To comply with my non-disclosure agreement, I have omitted and obfuscated confidential information in this project overview. All information is either my own generalization or is publicly accessible information. It does not necessarily reflect the views of Panasonic.
Role:: Sr. Manager; Product Design & User Experience, UX Product Design Lead
Software:: Axure, Sketch, Principle, InVision, Adobe CC, UserTesting, Miro
Front-End:: HTML5, React, ESRI (ArcGIS)
1
Innovation Through Progressive Disruption
Current transportation systems management and operations face a number of challenges and constraints. Aging infrastructure. Increasing traffic volume. Outdated technology. Budget cuts. Space constraints—and the list goes on. While there is no silver bullet to all of these issues, we can look to provide solutions to real operator pain points and improve roadway conditions.
What if we could drastically reduce the time it takes for traffic operators to get the roadway insights they need in order to take appropriate action? What if they didn't have to juggle so many tools and navigate through clunky, dated software? That would mean faster public awareness of dangerous conditions. More roadways events could be accounted for. Less cognitive load and potential for mistakes.
It would mean moving the needle on actually improving safety and reducing congestion for millions on the roadways.
Setting the Course
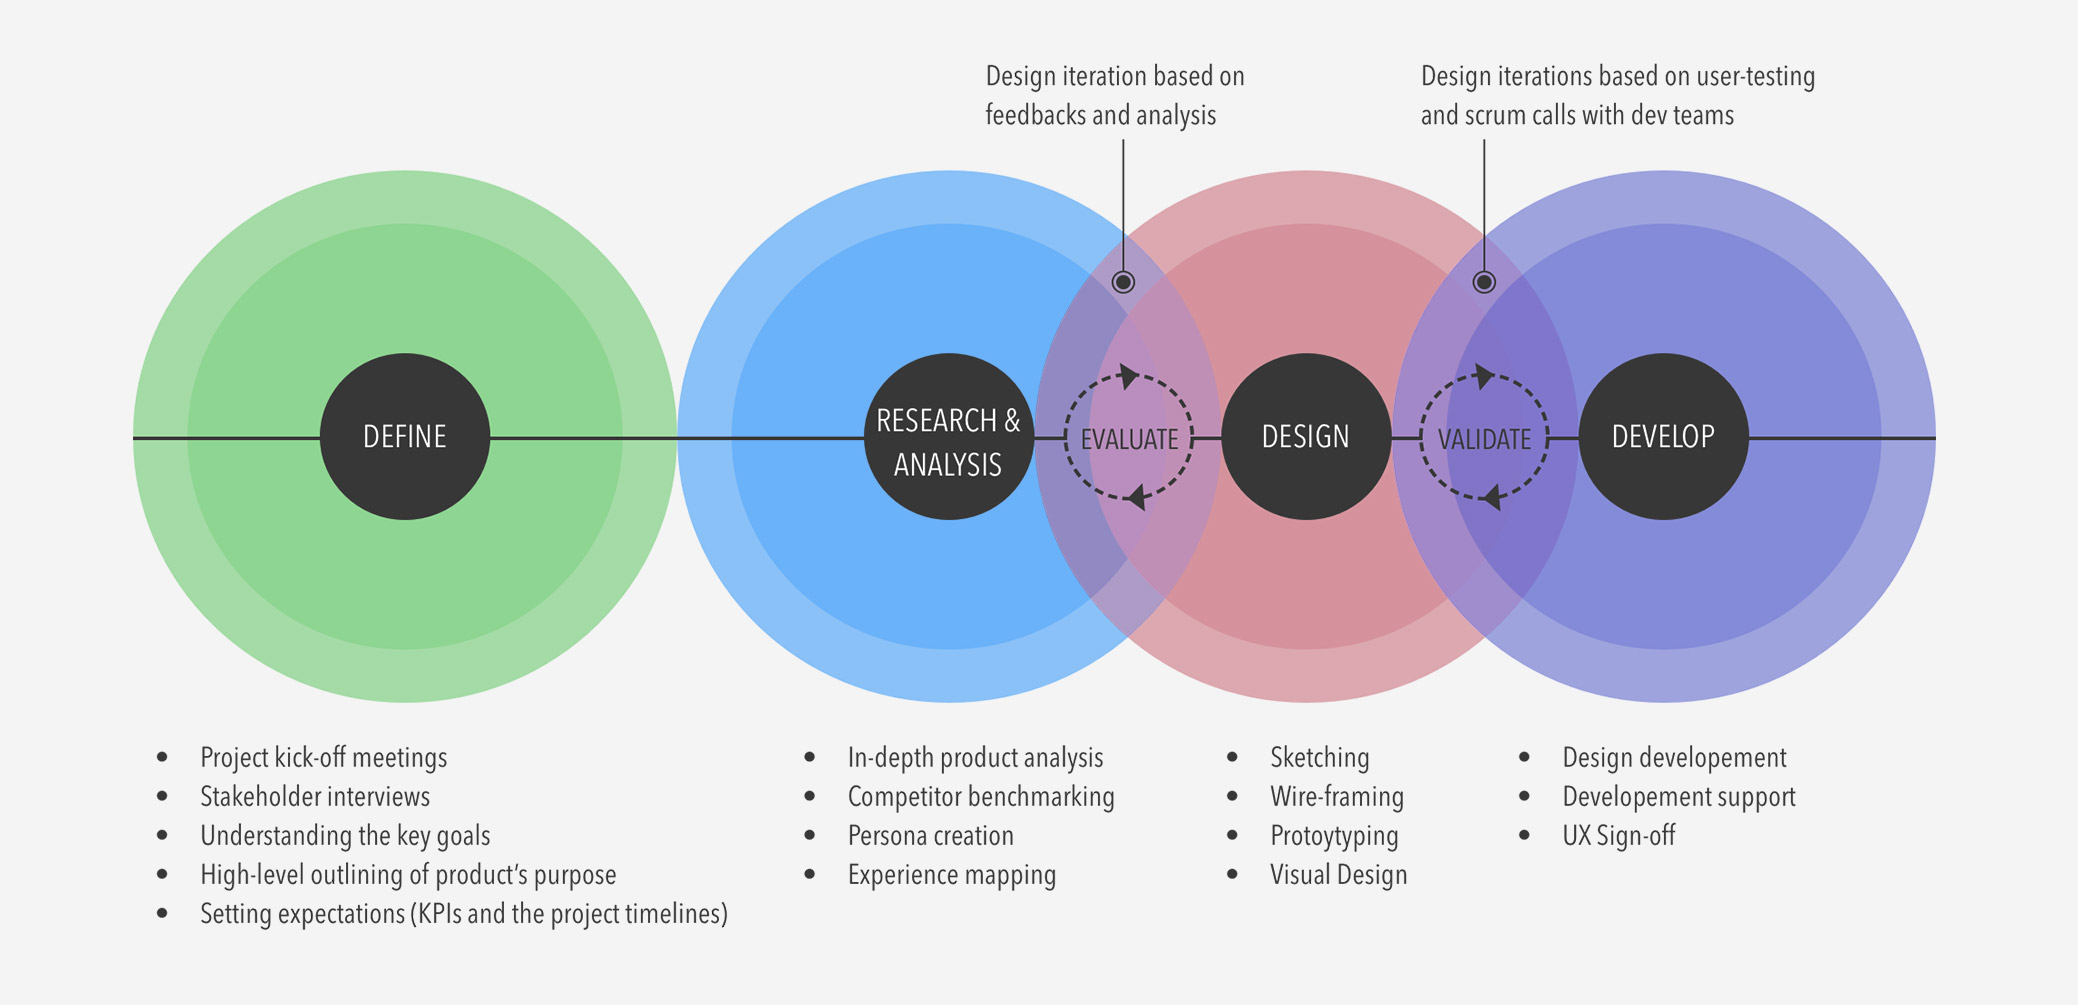
In order to reach the goal the project set out to achieve, we needed to really learn to master the agile UX process in a connected vehicle industry with many constantly changing/evolving parts, as well as embrace the ambiguity of the space itself. At the same time, we needed to also influence government entities - a very slow falling waterfall - to embrace it as well. Certainly no small feat.
After some adjustment period and education of the benefits of agile product development, we generally were able to work rather iteratively, as hoped for, in a process resembling a typical UX model. Both design, and systems, thinking approaches have certainly been used at different times.
Discovery & Analysis
Obviously, we first needed to fully-understand the problem-space, who our users are, and where their gaps and pain points are in their overall user journey. This was done using various methods and activities such as: user and stakeholder interviews, affinity diagrams, gap analysis, mental models, competitive analysis, user journeys, and persona development.
The Product Design team works closely with the Analytics, Research, & Insights team and Product Owners here to synthesize the analysis done and develop solution direction and new feature ideation.
By understanding both user and business opportunity, we are able to confidently drive the solution design forward and measure against targeted KPIs.
Trends & Takeaways
While we are always discovering new insights, we developed a good foundation of insights that we could move forward with and continue to refine. Without getting too specific, some general takeaways to go off of were:
- Operators can work in very different environments and each have their own unique setup preferences
- They use a wide array of internal and external tools in order to figure out roadway conditions before taking action
- Understanding roadway conditions takes a decent amount of time and many times requires very manual and/or analog processes
- A commonality was that they all used a handful of monitors together in a workstation setup - limited laptop and no tablets or phones
- Their primary traffic monitoring software is extremely dated and convoluted
User Engagement & Design Validation
From Discovery and Analysis, we get an idea of what key user pain points and workflow gaps we should tackle next. We may not always hit the mark initially every time -- and that's great. Test early and fail fast.
We are always leveraging the continuous user research insights and analysis as a guiding compass which feeds the collaborative user engagement model. Here we are able to refine conceptual designs and iterate towards ideal solutions by getting face-to-face (zoom-to-zoom lately) with our key user personsas.
Design Strategy and Approach
Based on a good amount of initial discovery, user analysis, and a deep understanding of our key user personsas, a some of the key takeways above stood out in terms of providing design approach direction.
User Customization & Flexible Workspaces
Based on all of the different takeaways identified, an important user need to address, as well as differentiating opportunity, was to really focus on user customization through modularity. By allowing the user to adjust and fine-tune their workspace preferences, a variety of pain points could be solved for through good UX practices and a dynamic, flexible design system.
Atomic Design System
The development of the Cirrus Design System using atomic design principles has been an integral part of quickly designing, building, and iterating on solutions with dynamic modularity built in. There were some key factors to account for, based on discovery insights and general UI best practices, such as ADA compliance and component utility consolidation. With so many data-based inputs and variations that need to be supported, it's important that the system place high importance on developing the least amount of multi-purposed atomic components to counter back-end complexity.
Responsive Design Approach
Given that the target user personas all use fixed workstation setups or laptop computers, a desktop-first approach made sense. Phone and tablet devices did not have an immediate place in the users' workflows and therefore did have much of an emphasis in creating design solutions.
Graceful Degradation
The user experience solutions are created with larger resolutions in mind for a reason, but there is still a need to support much smaller laptop sizes, where ideal workflows cannot directly translate. As a result of this, prioritization of key elements results in a slightly different experience which still aims optimize proposed workflows the best it can.
Measuring Success in the Feedback Loop
Both qualitative and quantitative methods are used to gauge the success of our solution design against epic/feature KPIs and general usability and user satisfaction metrics.
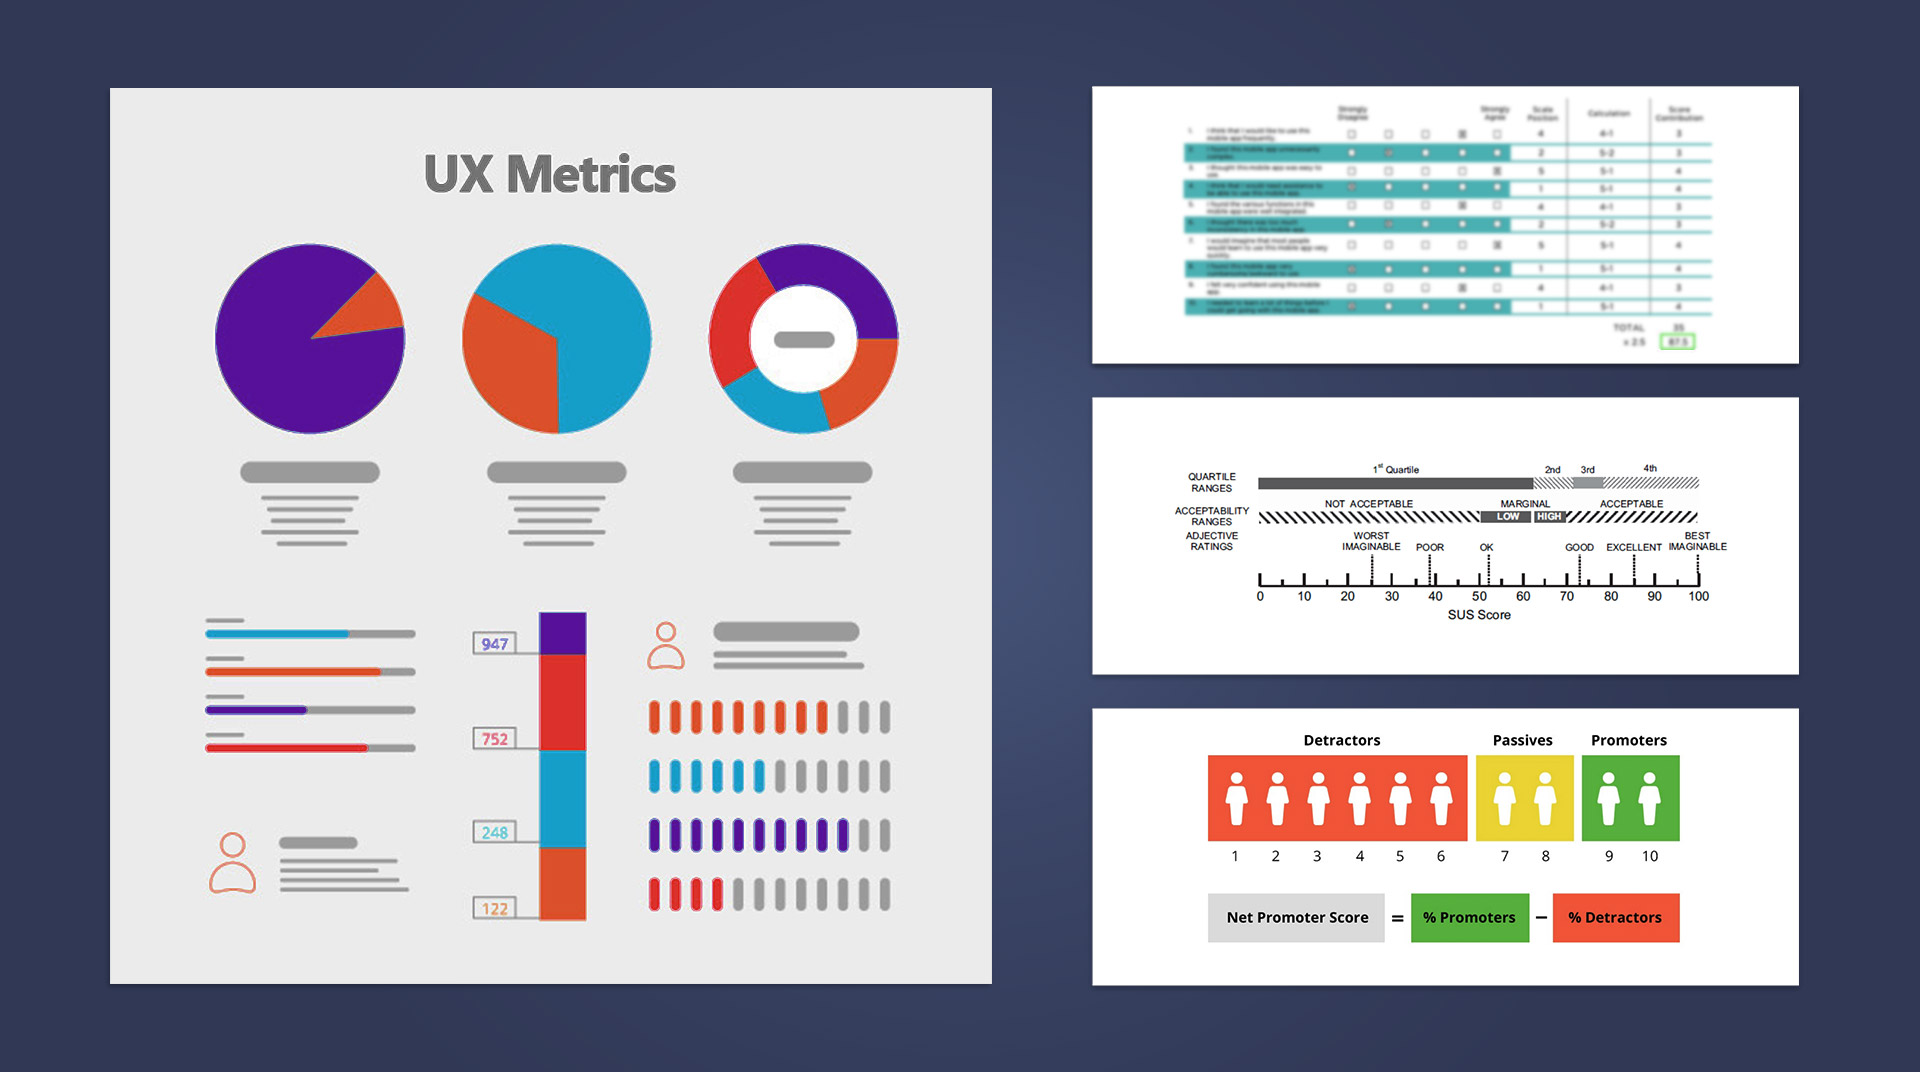
Success, given the balance of satisfying user needs and business goals, is measured in a number of ways. Key Performance Indicators (KPIs), specific to the epic or feature, are generally where business/product goal success are measured. User-focused needs and success criteria also get defined in KPIs, but also get measured by more traditional UX metrics and methods.
System Usability Scale (SUS) scores were generally constant between 80 and 90 on new features and concepts, well above the 67 mark of 'good.' Customer Satisfaction Scores and Net Promoter Scores were also used during various user engagements with positive averages.
Cirrus by Panasonic
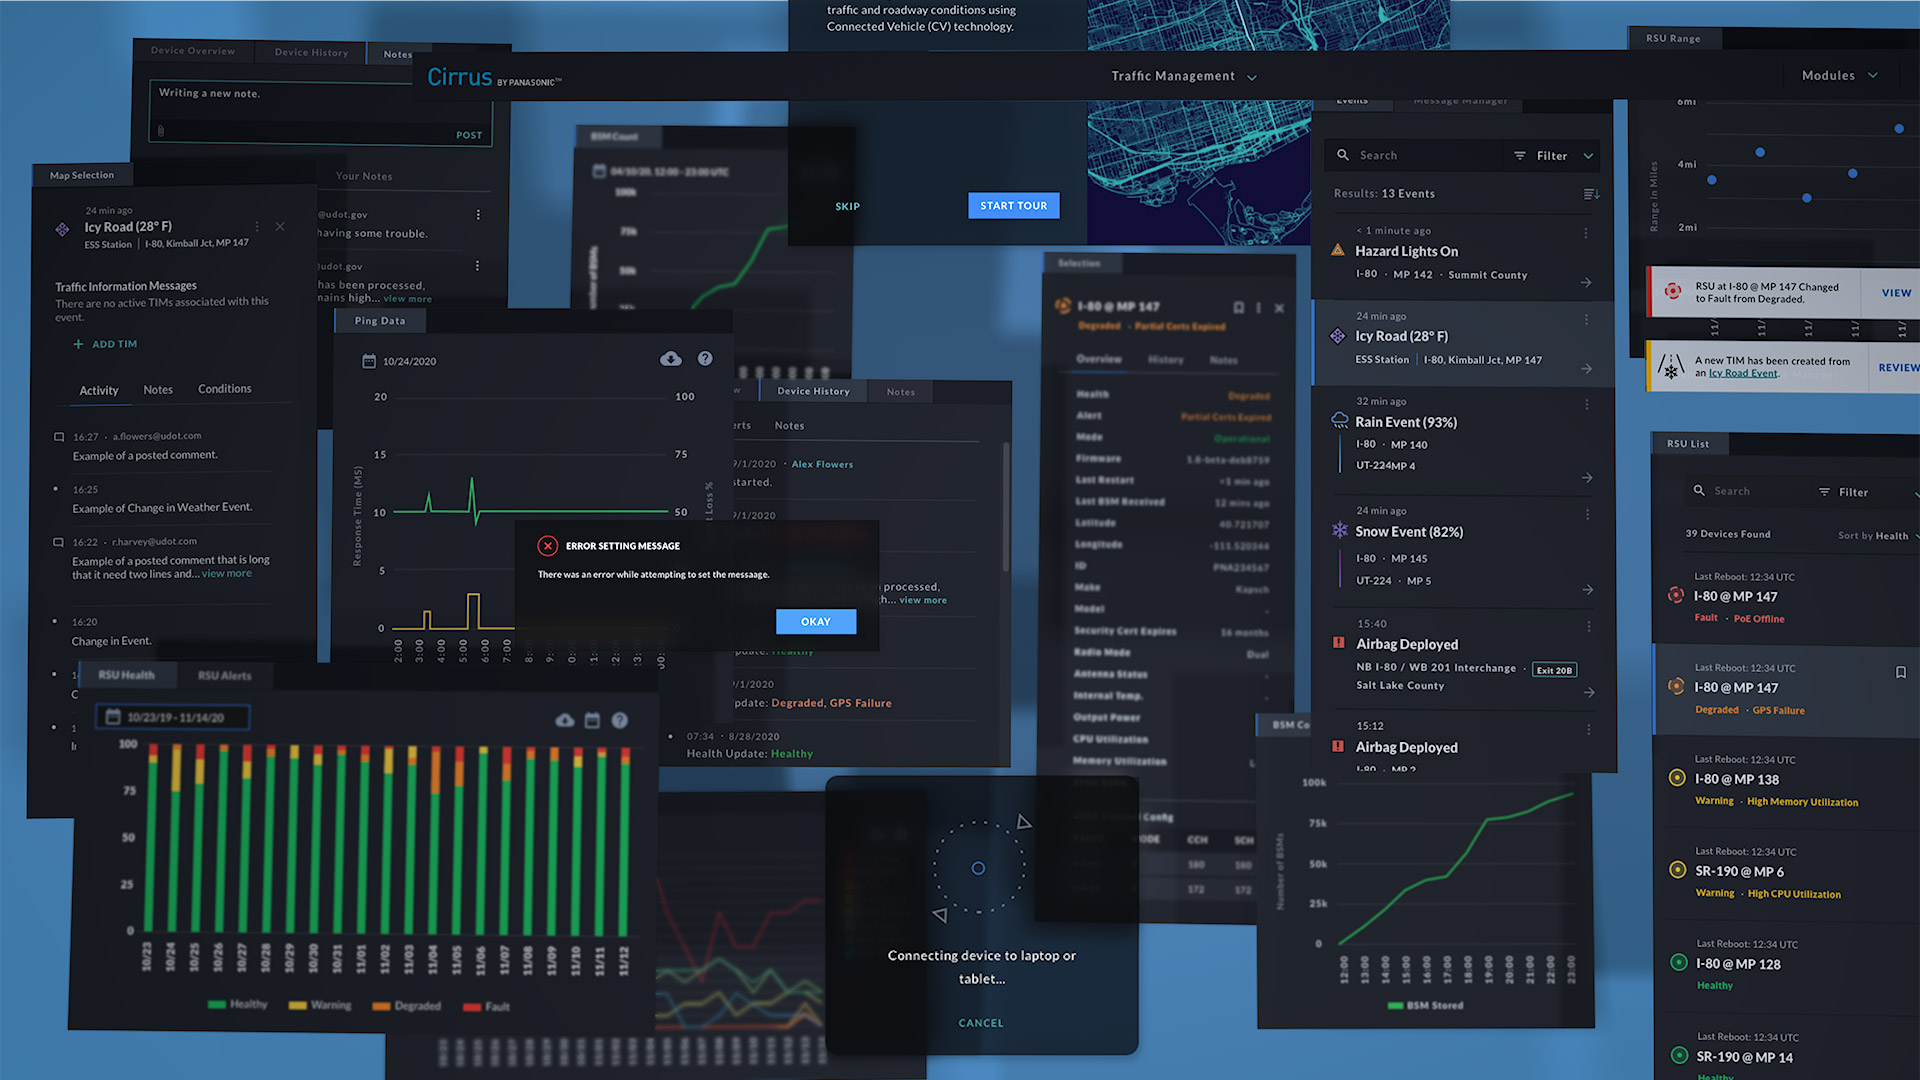
Below are some generlized, high-level previews into some of the aspects of the Cirrus product that have been worked on over the last few years.
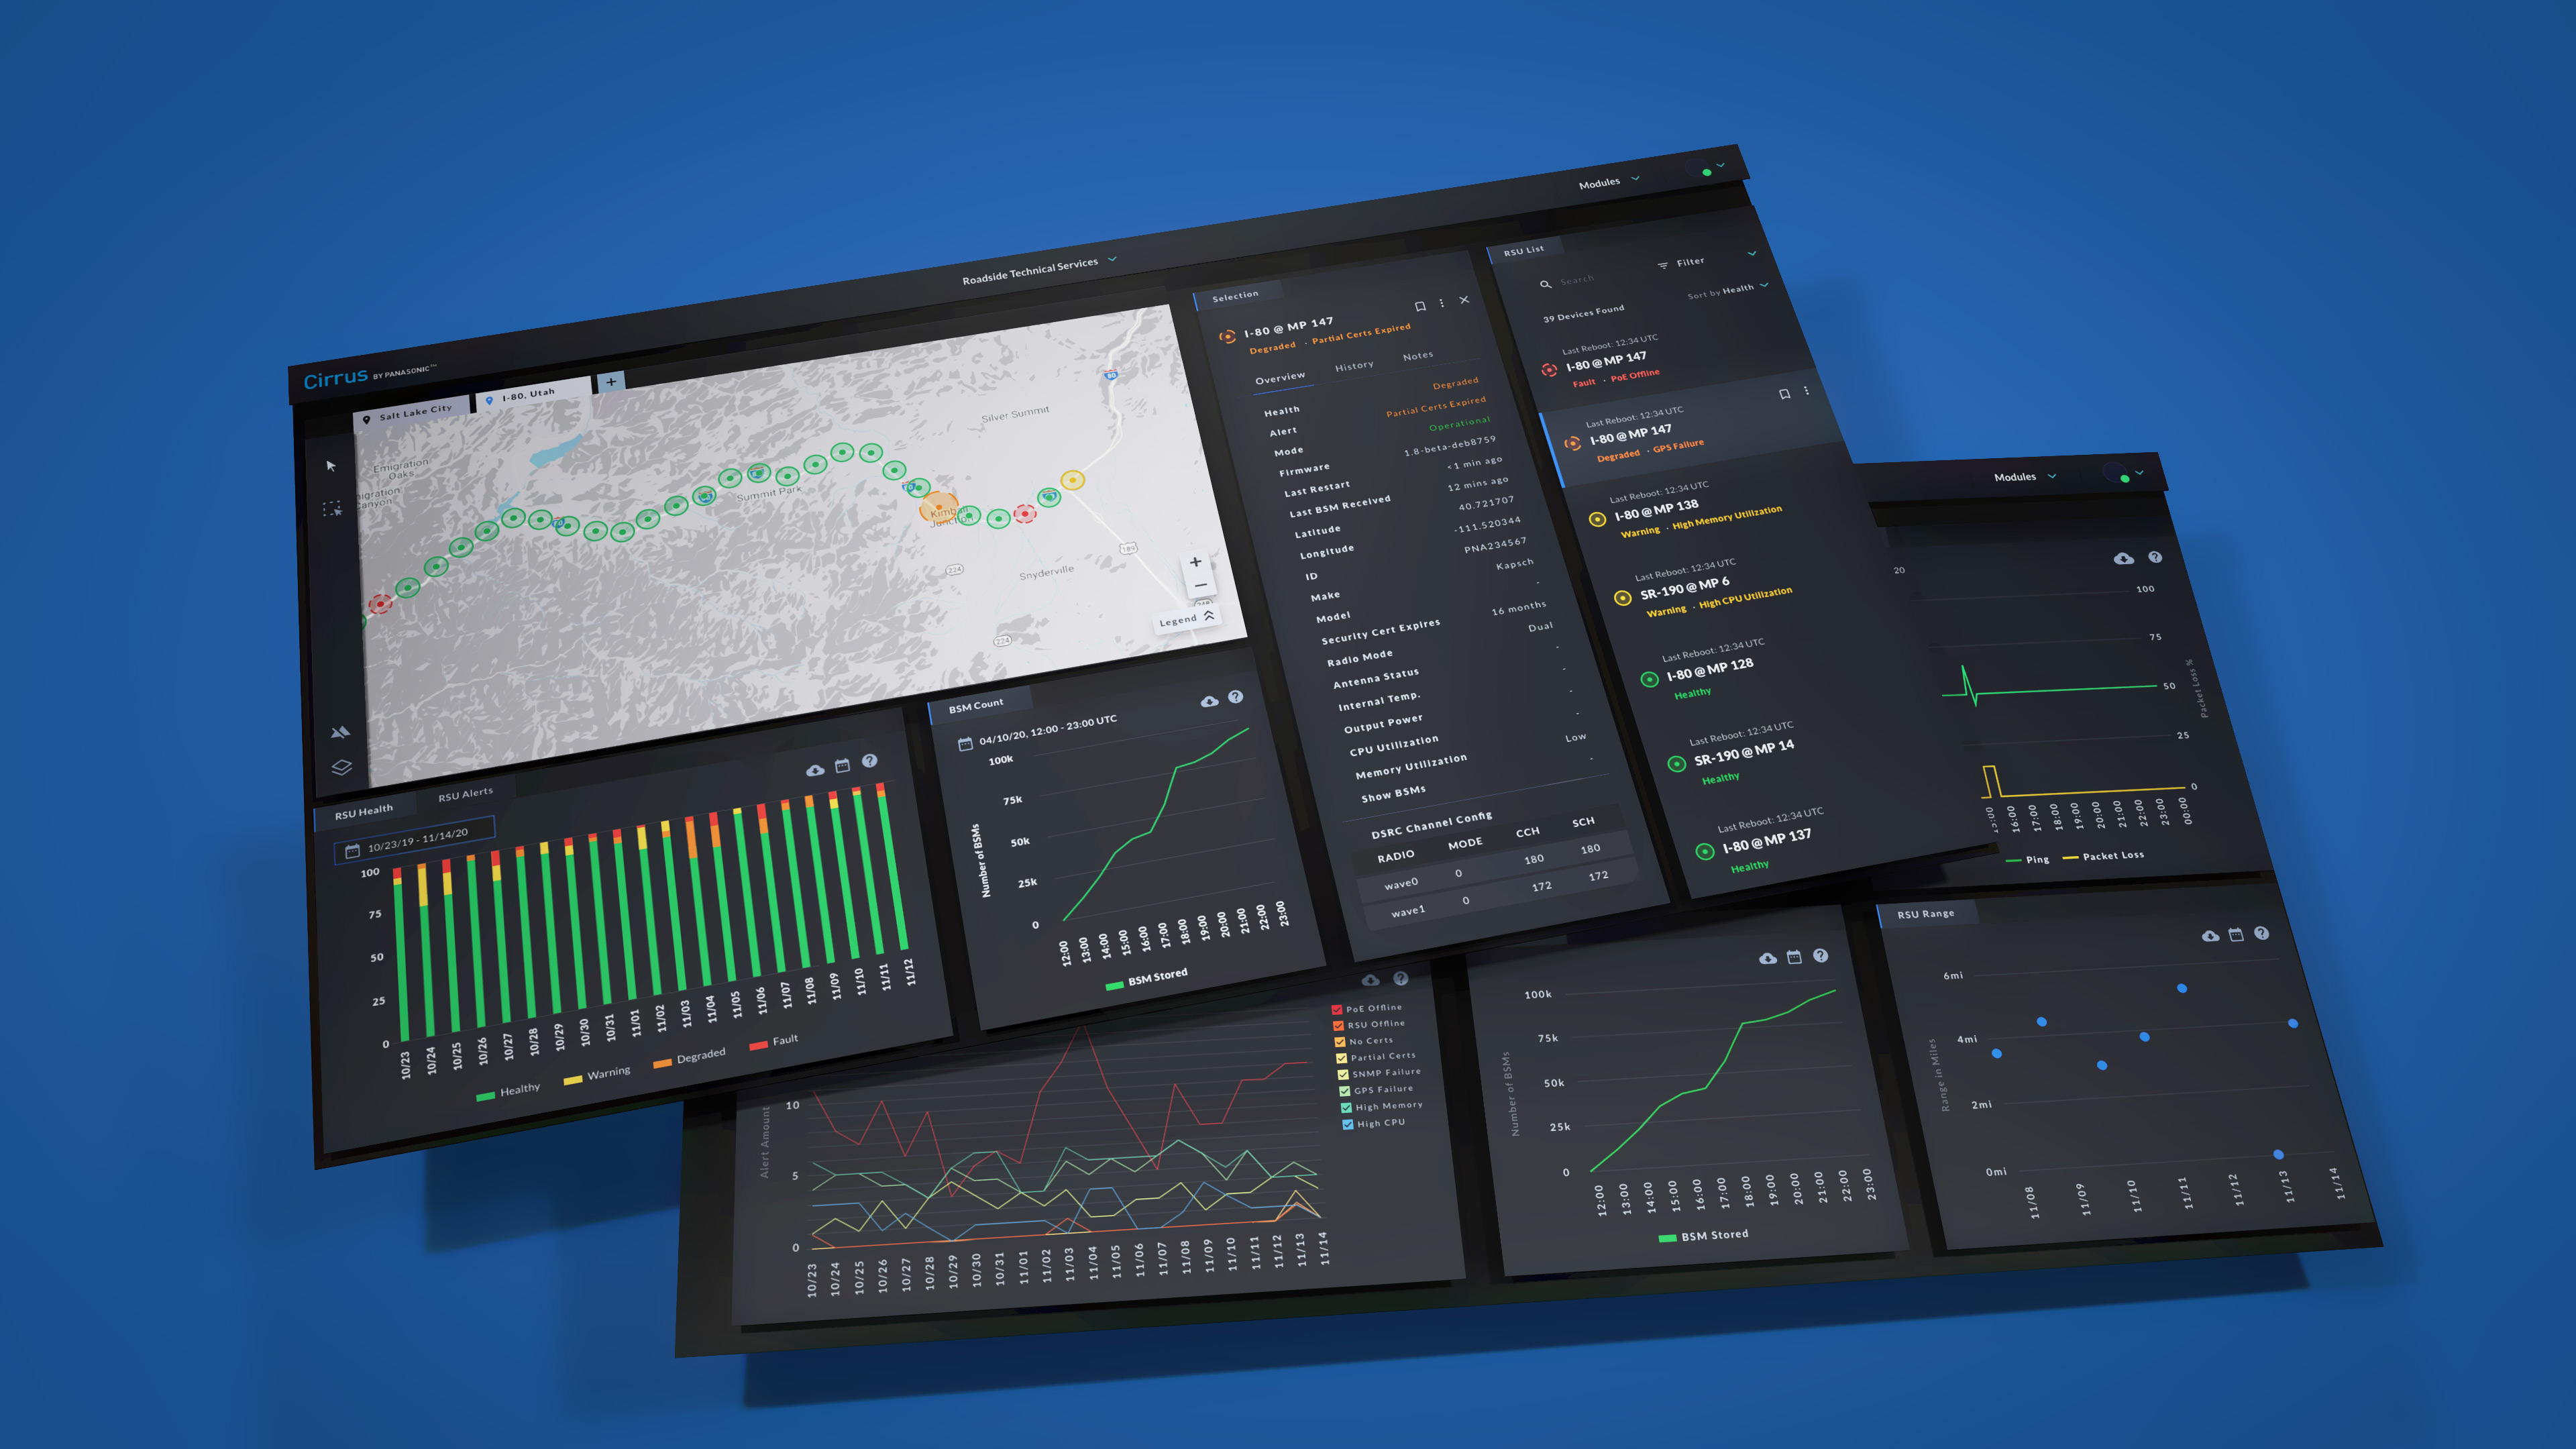
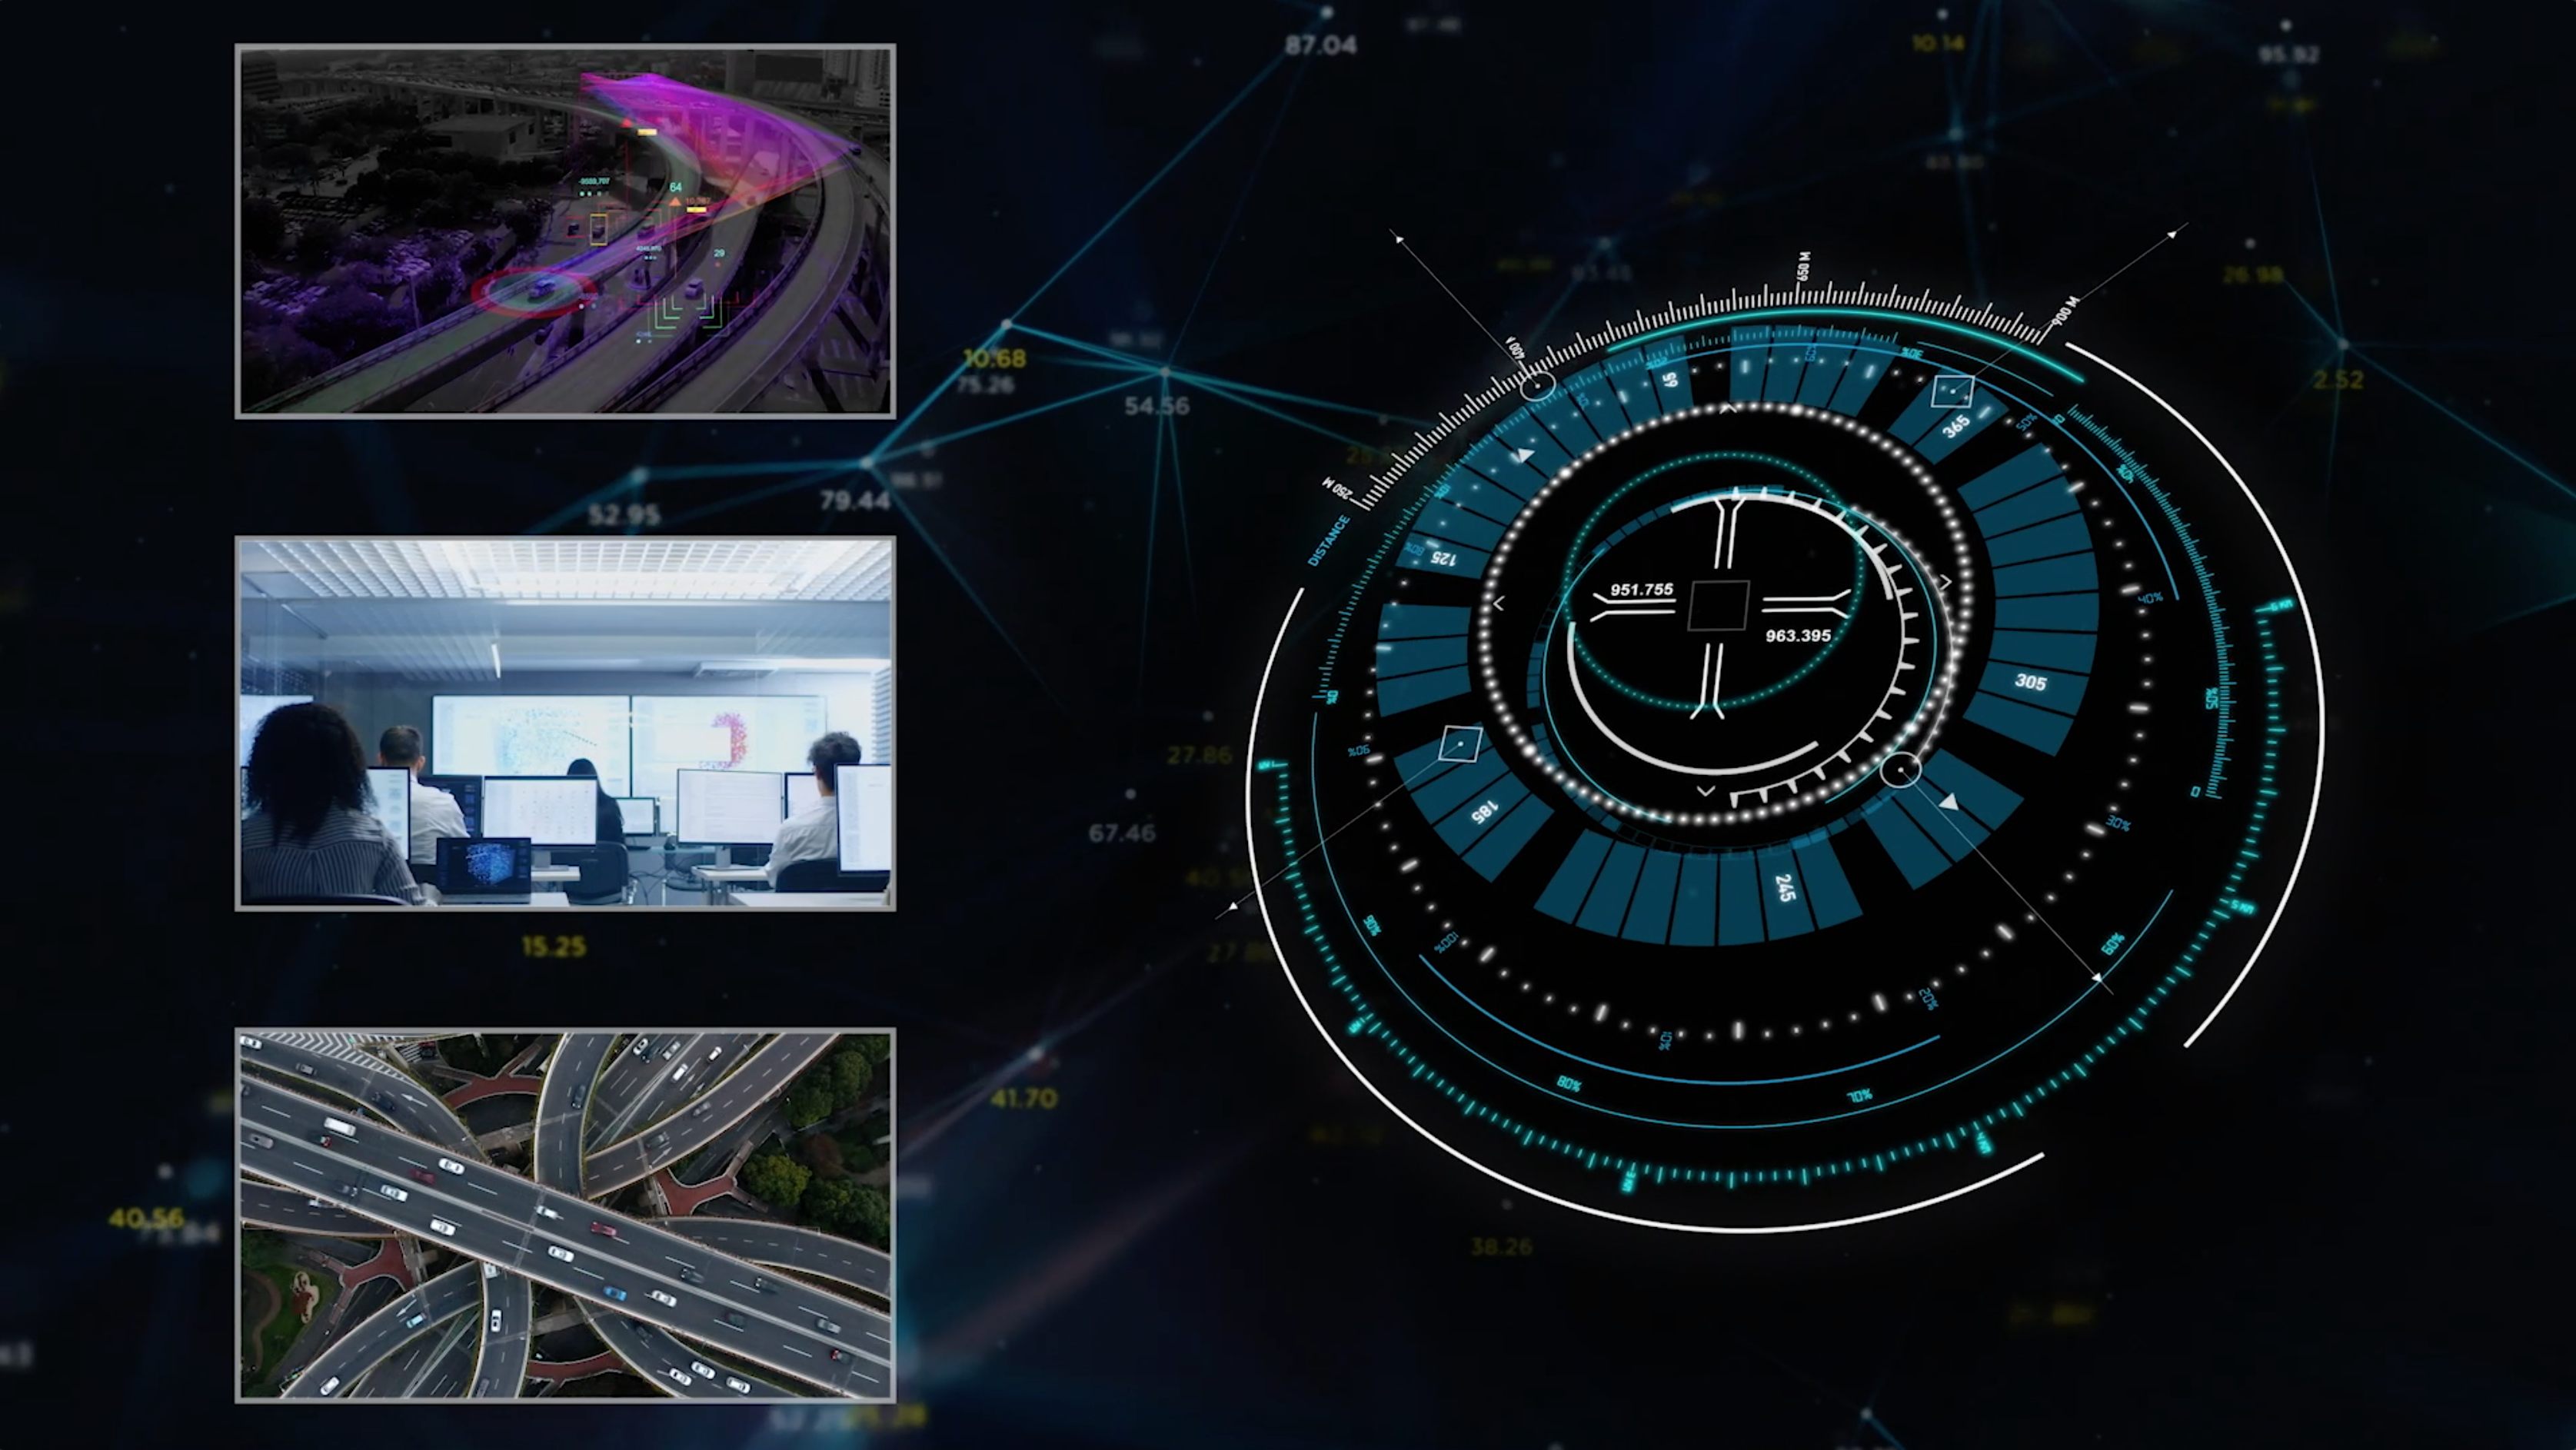
Mobility Technical Solutions - CES 2021
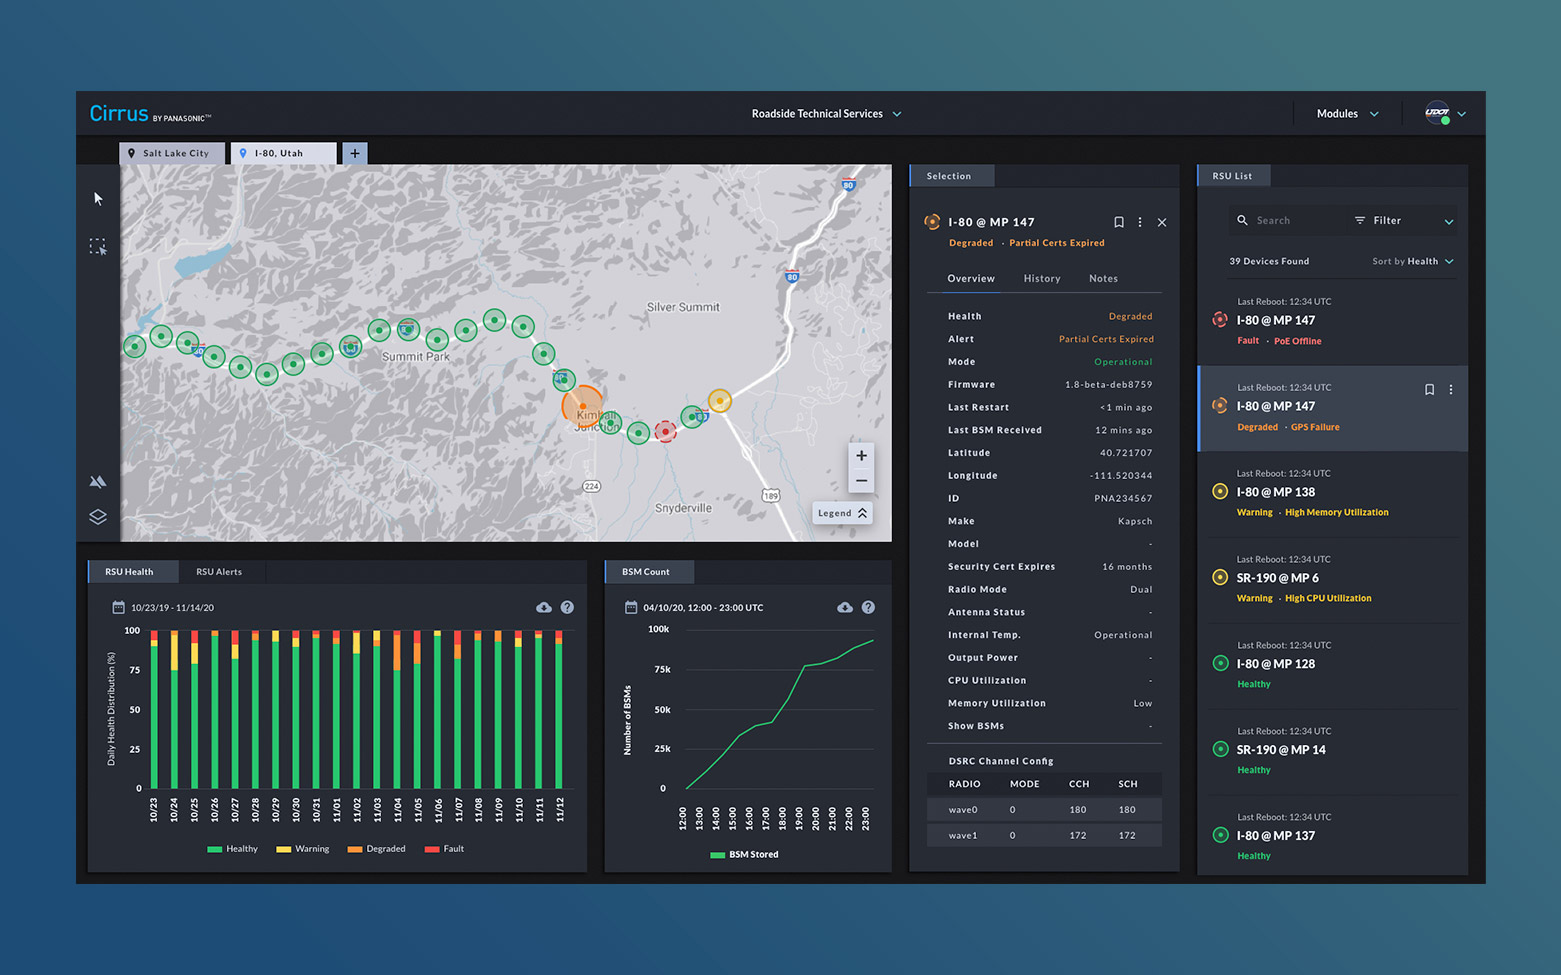
The technical backbone of Cirrus - the MTS application - puts advanced deployment capabilities in the hands of technical installers operations and maintenance professionals, and hardware specialists.
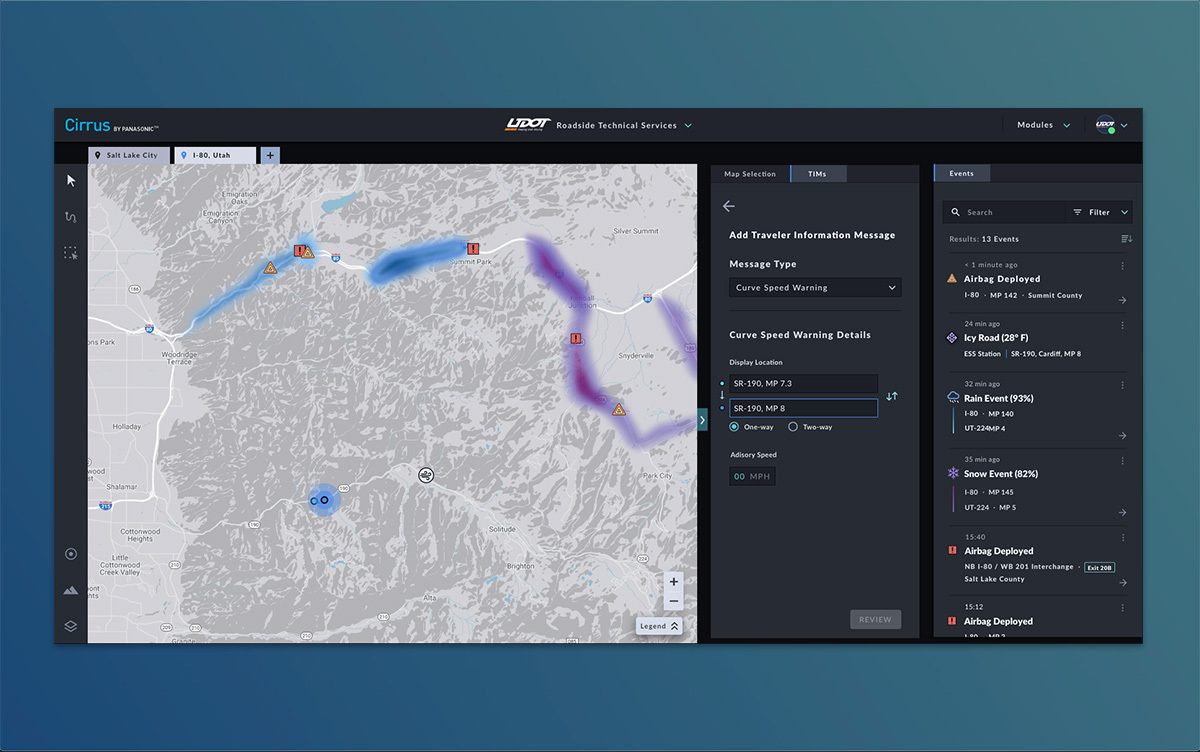
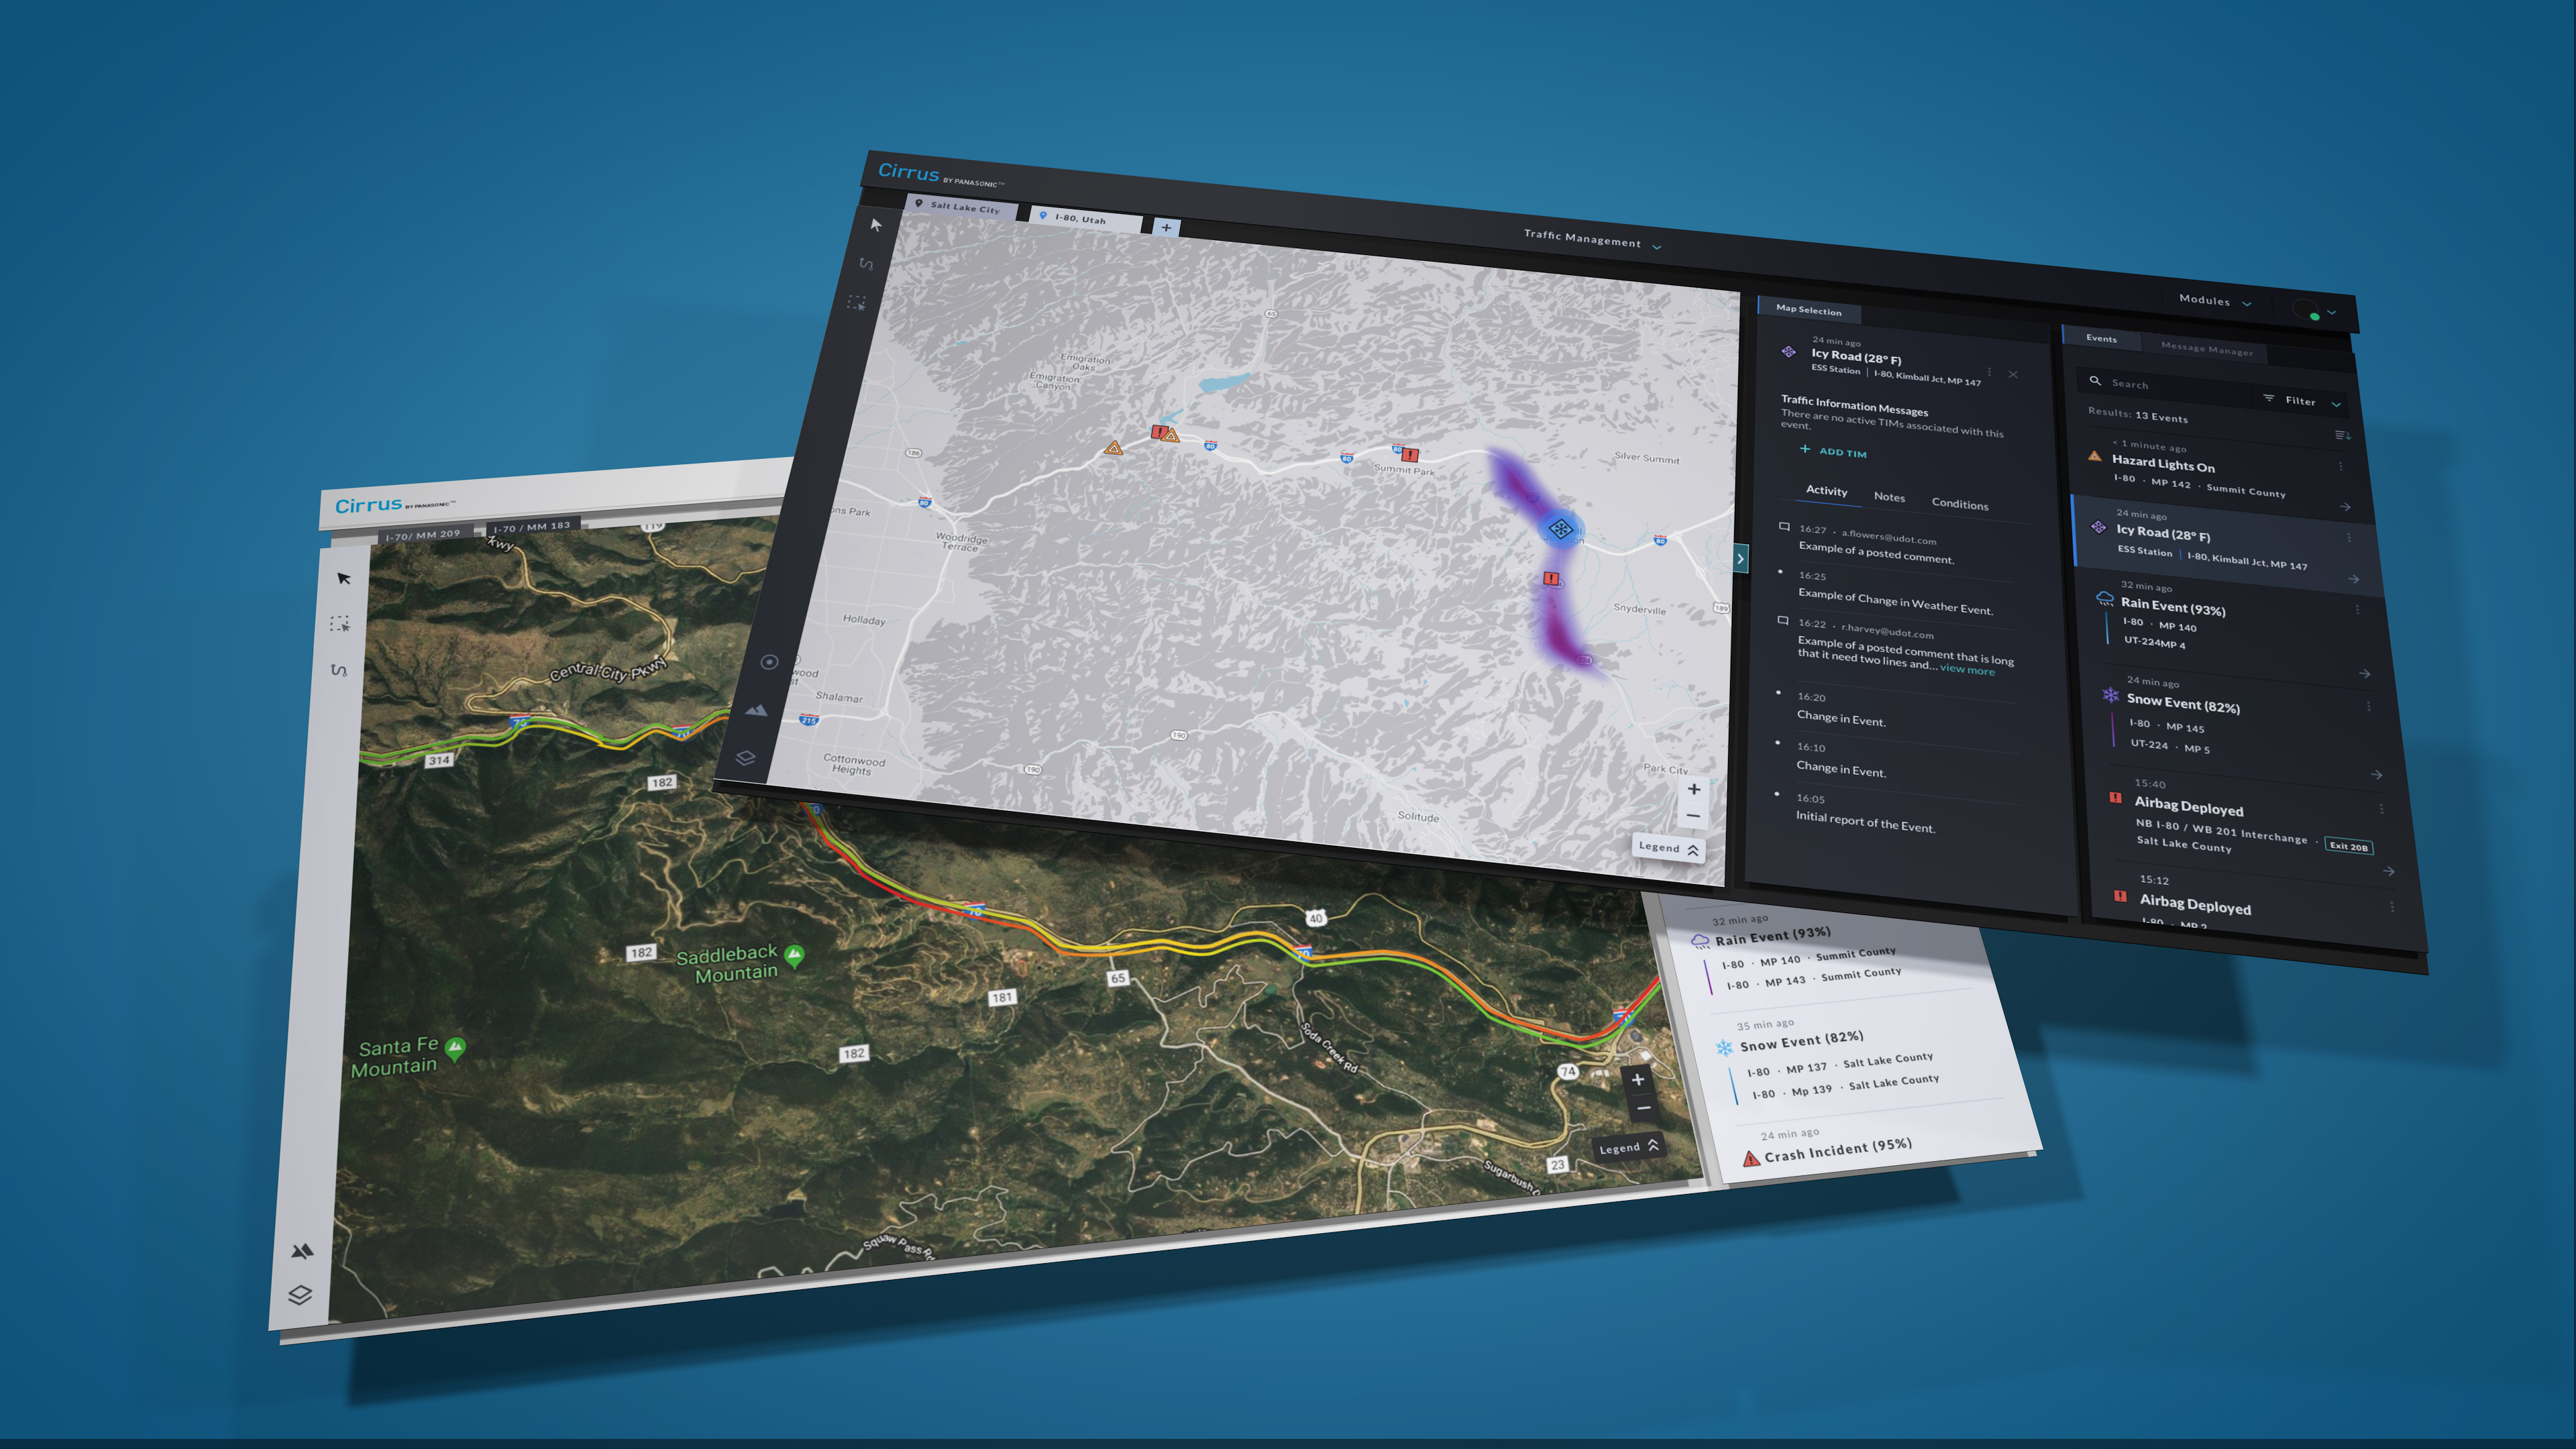
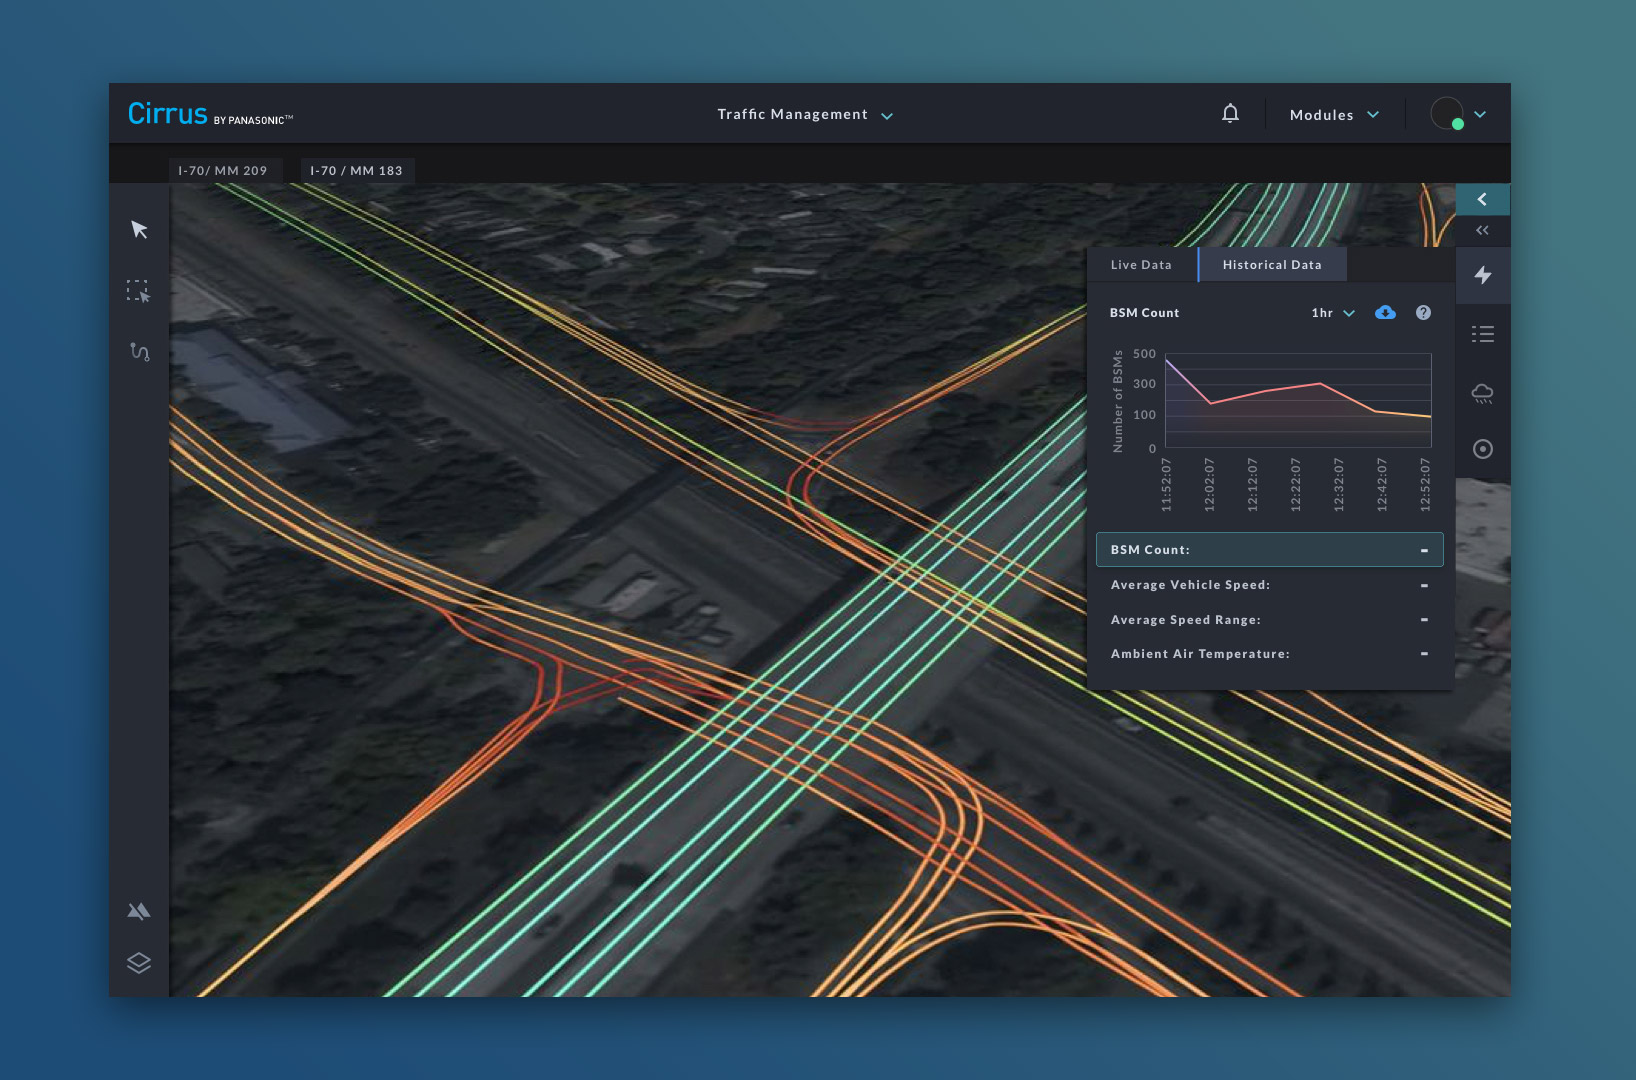
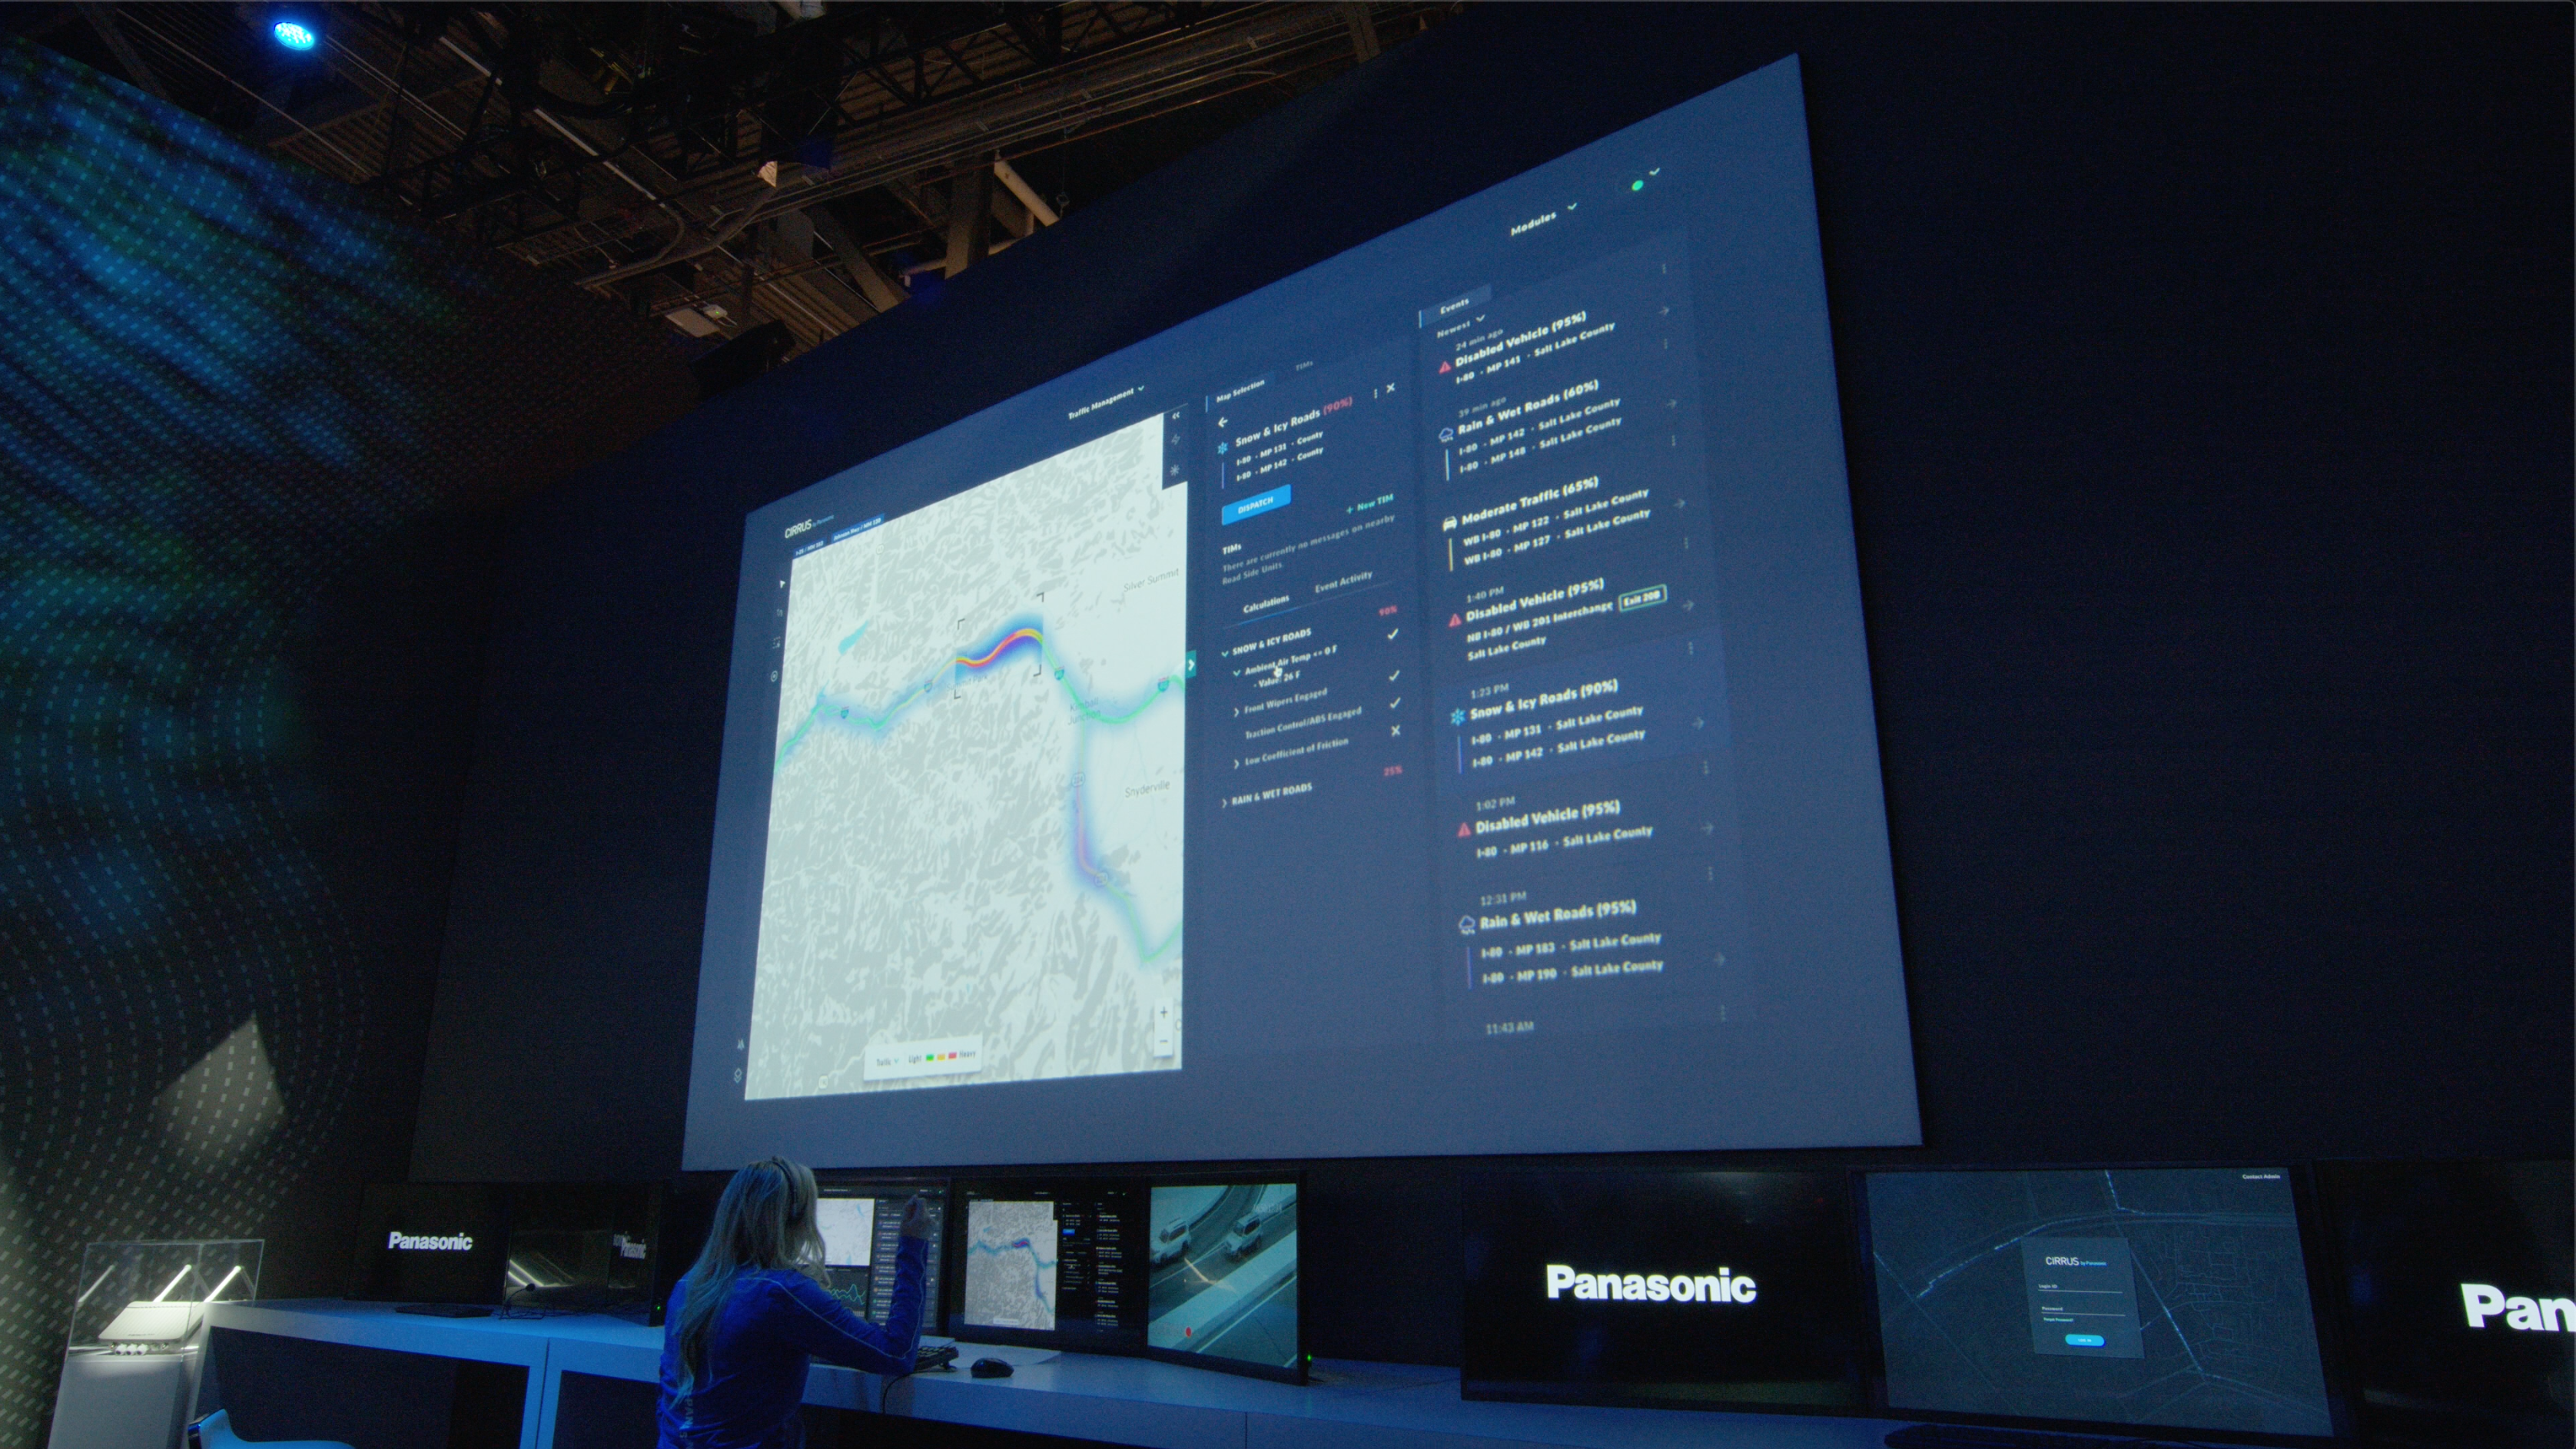
Traffic Management - CES 2021
The Traffic Management application allows DOTs to monitor real-time traffic and roadway conditions. By creating a connected transportation ecosystem - an "internet of transportation" - traffic operators will receive synchronous information about road conditions. By leveraging V2X technology, this system will allow operators to not only receive advanced roadway insights, but also the ability to send actionable messages back to connected vehicles.
Component Motion Example: Active Progress Modal
Example of some motion design for a progress modal.
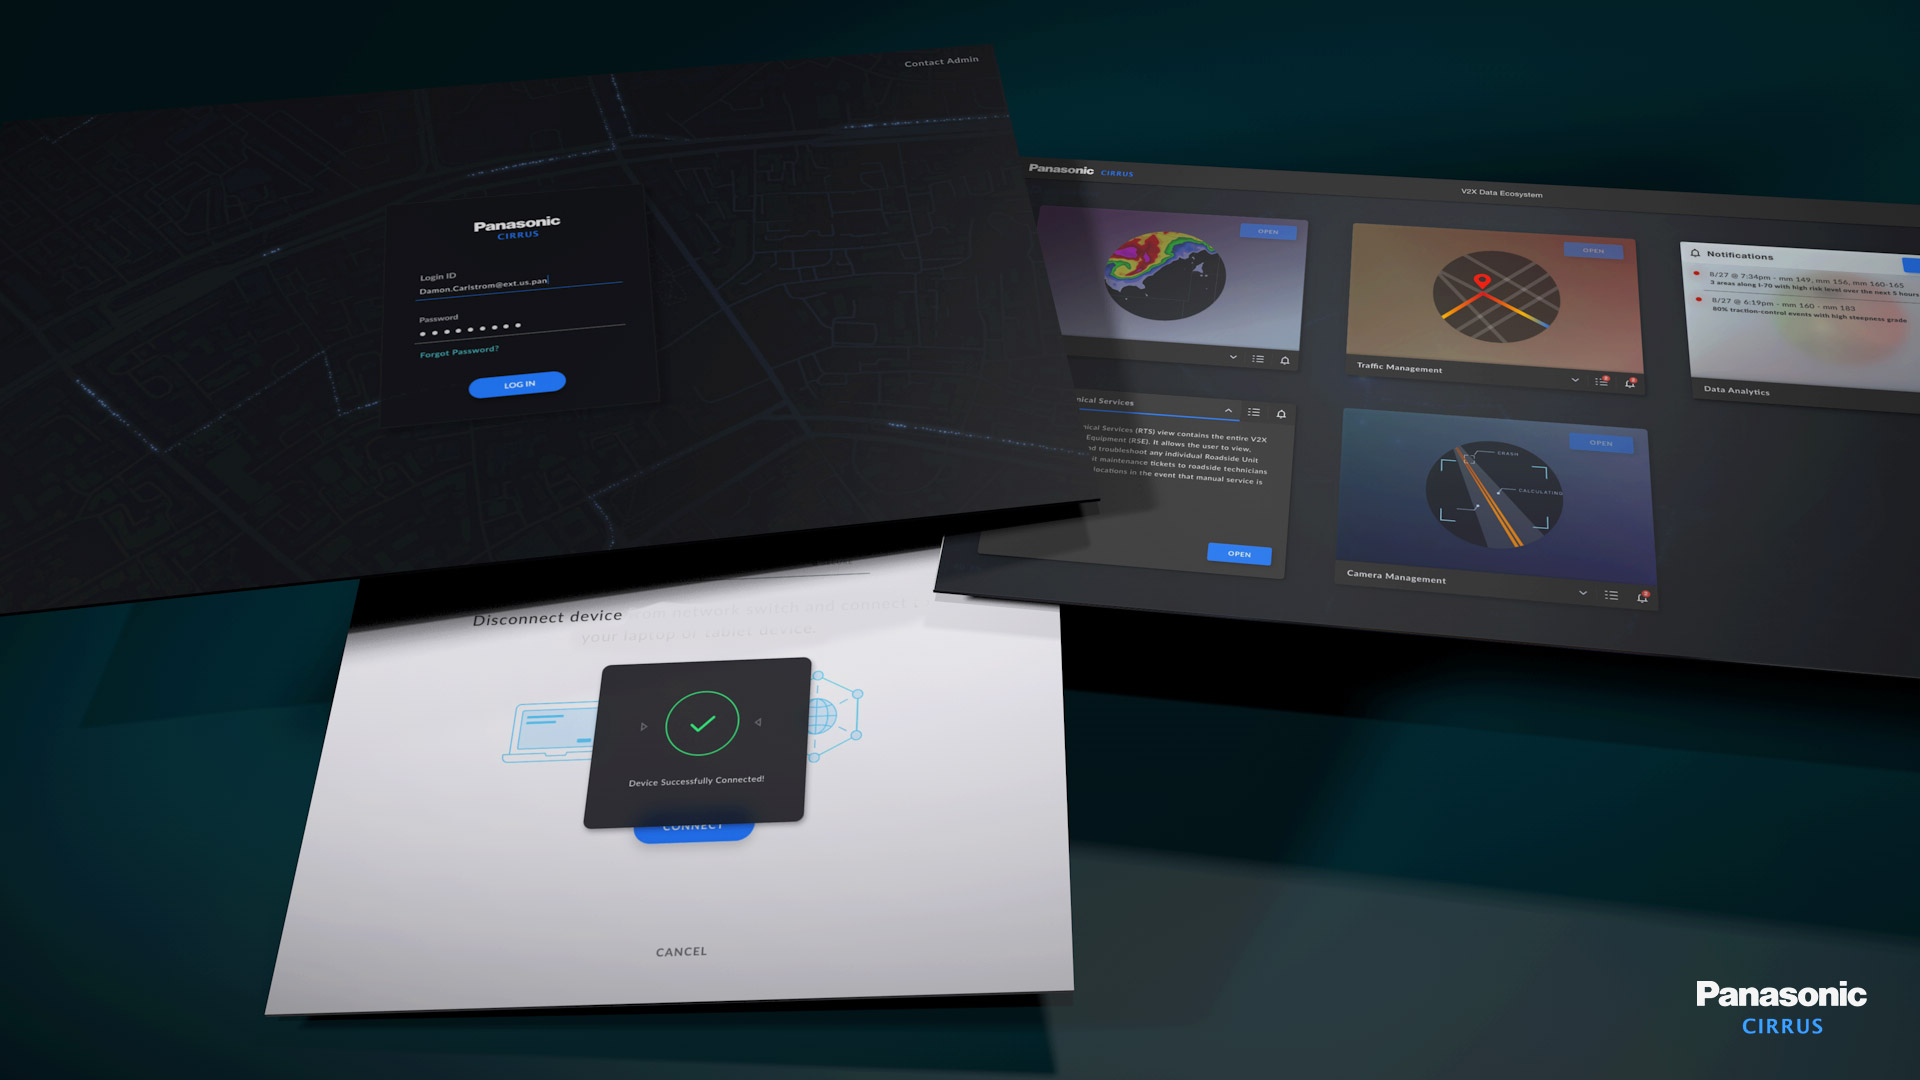
Cirrus Access Screens - CES 2021
Creative Direction
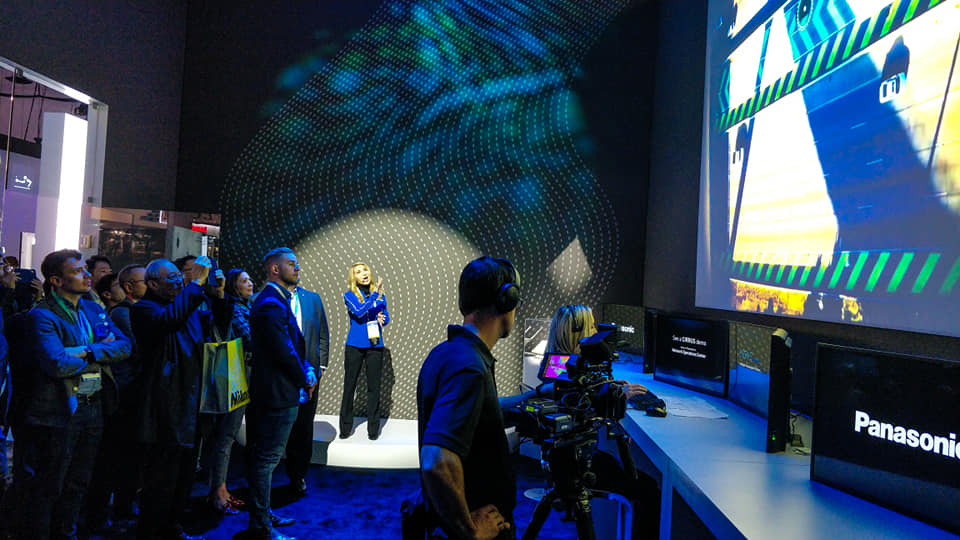
On top of my primary role on the team, I also have a side role in providing creative direction and marketing support for Cirrus. By working closely with business development, public relations, and marketing departments, I help translate business and product goals into strategically executed creative deliverables, advertising initiatives, and general recommendations.
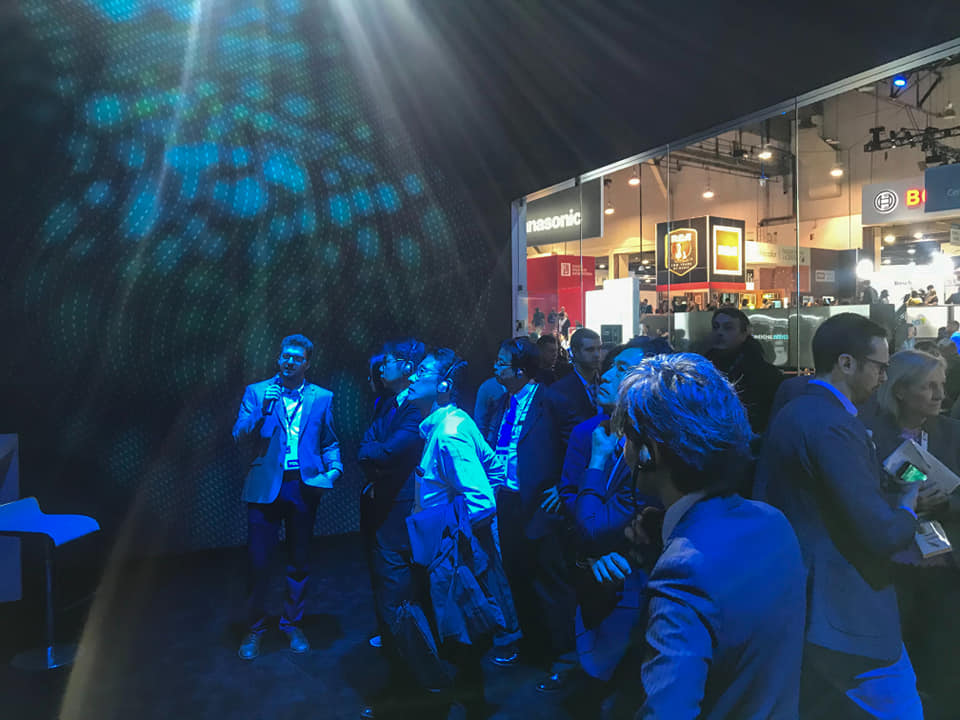
A good amount of this responsibility relates to industry events and conferences. The most notable of these events has been the Consumer Electronics Show. For CES 2020, I took point on setting the tone, directing, and producing an immersive experience that showcased the Cirrus vision, value, and capabilities. Cirrus by Panasonic was a CES Innovation Award Nominee.
Looking Forward
The project is planned over a long period of time and new developments, features, and value is being created every day. Feedback from the customer is an important part in the agile process and will continue to drive product direction along with the business goals that get developed along the way.